By Kirstie Hostetter
Sustainability Analyst Intern
Sustainable Investment Group (SIG)
With the 2016 presidential election fast approaching, both Republican and Democratic debates have included questions regarding candidates’ education policies. While we hear a lot about teacher performance, student test scores, and other statistics describing the people inside schools, we hardly ever hear statistics about the schools themselves. That is to say, what about the actual, structural buildings where students and teachers spend the majority of their time five days a week?
The truth is, until today, we didn’t really have those statistics. The last comprehensive survey of the physical state of our schools took place 20 years ago. So, the U.S. Green Building Council decided to compile their own statistics by conducting an unprecedented, national survey of K-12 school buildings. The results of this study were released just today in USGBC’s “State of Our Schools” report.
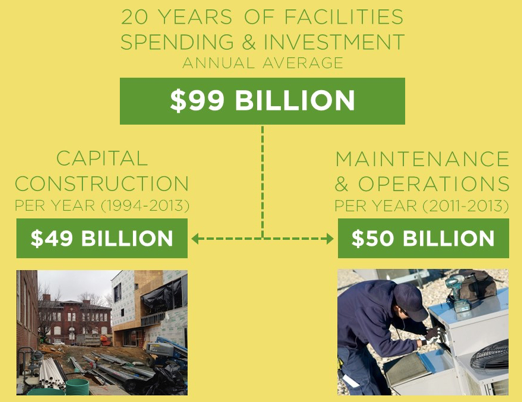
So what is the state of our schools? In summary, out of the $99 billion spent annually on schools over the past 20 years, $49 billion of that total has gone to capital construction while the other $50 billion has gone to maintenance and operations (M&O). USGBC’s report found that local communities pay 82% of their own capital construction costs and 45% of their M&O costs. The rest of funding for capital costs and most of M&O costs come from the state level, with the federal government only contributing to 10% of maintenance and operations costs. Because of how these school budgets are structured and funded, school facility quality varies significantly based on local income levels.
In each district, school officials must choose how to allocate M&O funds especially between structural maintenance and personnel operations. In sparsely-funded school districts, many times these financial decisions come down to either repairing an aging roof or funding a teacher’s salary. When maintenance repairs are deferred longer than they should be, M&O dollars are used reactively instead of proactively, and translate to an inefficient use of funds. In this case, the district would eventually have to pay for an entire roof replacement earlier than it should, which will then strain monetary resources for teacher salaries later on. By not separating structural maintenance and operations costs from other M&O costs, we have created a vicious cycle of under-funding within districts that are already strained financially.
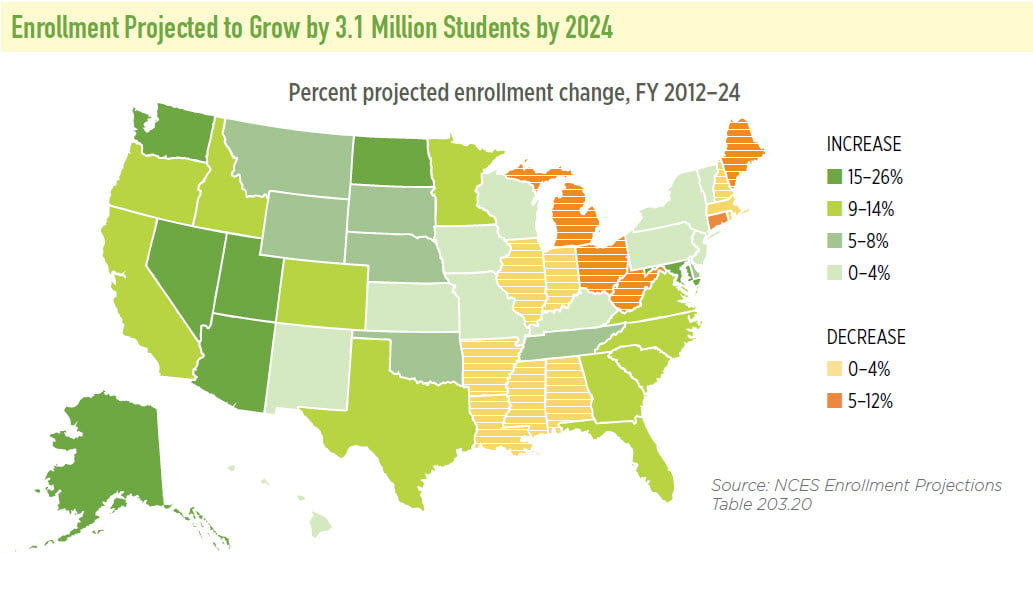
Looking to the future, the “State of Our Schools” report predicts a gap in annual spending on our school facilities of $44 billion nationally. This number breaks down into a $7 billion gap in M&O, a $27 billion gap in capital construction for existing facilities, and a $10 billion in capital construction for new facilities. With an additional 3.1 million students predicted by 2024, these funding gaps need to be addressed before more facilities fall behind, creating an even larger deficit in school investment.
Now that we have the statistics, what should we take away from this report? The physical buildings and sites that house 50 million students and 6 million adults every day are in need of more attention from policymakers. Not only do we need to invest our school dollars more efficiently, but we also need more of those dollars. USGBC points to Georgia’s Special-Purpose Local-Option Sales Tax (SPLOST) initiative, where a county can choose to levy a 1% sales tax to fund public facilities, as an innovative way of increasing funding for school districts.
Research shows that better school buildings can improve student achievement, reduce truancy, lead to better health, improve staff satisfaction and retention, and create higher property values. Proper maintenance of school facilities reduces the demand for raw materials, whose harvesting is a significant source of environmental damage, and increases the life-span of already existing buildings, eliminating needless waste of materials. When we choose to invest in our schools, we are choosing to invest in people, planet, and profit – a triple-bottom line that produces a higher quality of life for everyone.
You can find USGBC’s full report, including a break-out of statistics by state, at stateofourschools.org
All photos, statistics, and maps courtesy of the Center for Green Schools “2016 State of Our Schools” report and webinar.
© 2016 Sustainable Investment Group (SIG). All Rights Reserved.

